| Explanation |

|

|
| Thursday, 01 November 2007 | |
|
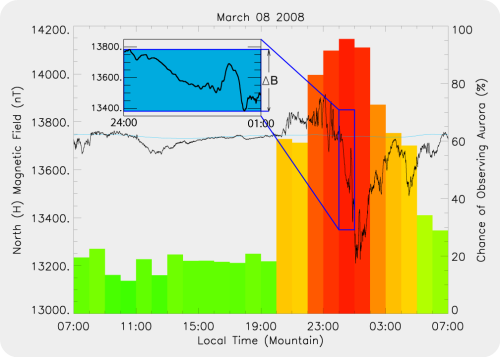
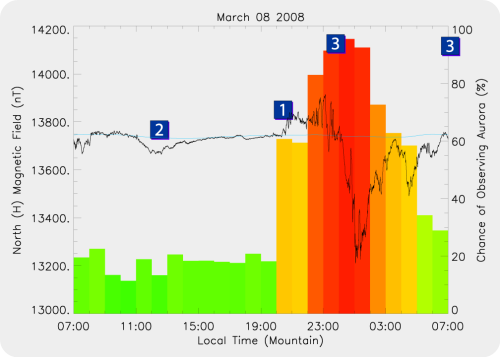
AuroraWatch forecasts are made by examining the behaviour of the Earth's magnetic field strength, which is measured by ground-based magnetometers. Specifically, we measure the magnetic field strength in the geomagnetic North-South direction (this is also called the 'H-component'). By comparing 10 years worth of H-component magnetometer data to aurora observations, which were monitored by a meridian scanning photometer (MSP), we have developed an algorithm for predicting the percent likelihood of observing an aurora in Edmonton, Canada, during the next night.  The algorithm measures the change of magnetic field strength every hour; the greater the change the higher the level of geomagnetic activity and chance of observing aurora. Figure 1 shows the change in magnetic field strength, displayed in the upper right hand corner as ΔB, between 00:00 and 01:00.  The prediction graph shows the previous 24 hours worth of H-component magnetic field strength data (in units of nanoTesla, black curve, [1] in Figure 2), measured by a ground-based magnetometer just outside of Edmonton city. Data from a geomagnetically quiet day is also shown (blue curve, [2] in Figure 2), for comparison. The bars on the graph show the hourly probability, as a percentage, of auroral displays occurring ([3] in Figure 2). The 'predictometer' displays the maximum hourly probability value calculated for tonight.
The AuroraWatch service offers two levels of warning which you may subscribe to:-
Regardless of the probability of auroral displays occurring, a clear, dark night is required in order to observe them. Note that the closer it is to midnight, the greater the chance of observing an auroral display.
|
|
| Last Updated ( Monday, 16 April 2012 ) |
| Next > |
|---|


 Aurora Watch Website. Version 1.0.